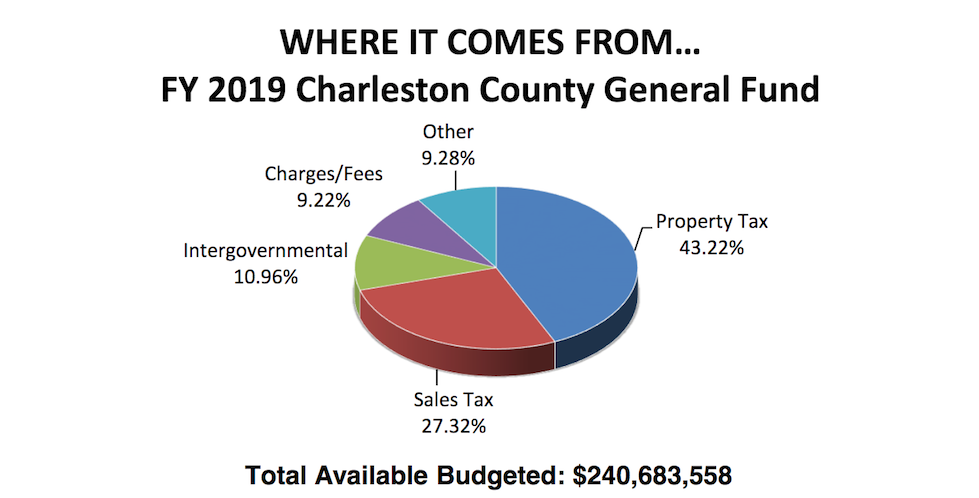
aThe 2019 Charleston County budget has been released and once again, distribution of funds is being is adversely related to the true needs of the county. Hidden behind a 504 page narrative, the focus of funding for the $240.7 million dollar budget is less on education, economic development and health/wellness than it is on culture and recreation.
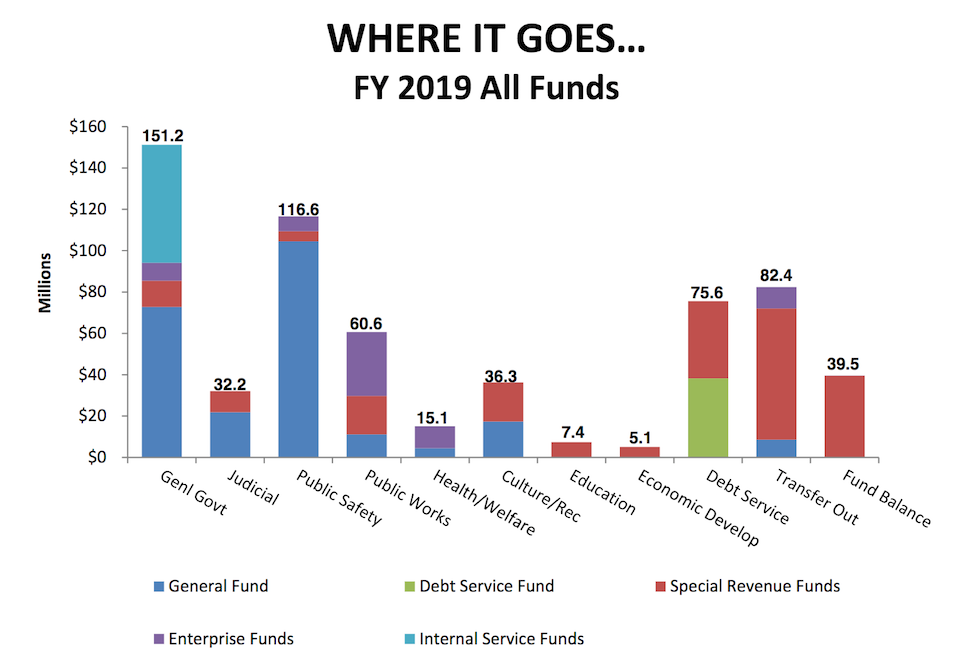
Here is the breakdown of categorical funding:
- General Government – $151.2 Million
- Public Safety – $116.6 Million
- Transfer Out – $82.4 Million
- Debt Service – $75.6 Million
- Public Works – $60.6 Million
- Fund Balance – $39.5 Million
- Culture / Recreation – $36.3 Million
- Judicial – $32.2 Million
- Health / Welfare – $15.1 Million
- Education – $7.4 Million
- Economic Development – $5.1 Million
Once again, Health / Welfare, Education and Economic Development round out the bottom of funding and if combined ($27.6 Million), all three categories still fall short of Culture / Recreation by $10.6 Million). As we continue to examine why education in South Carolina ranks in the lower 10% year after year, we do not have to look far to find answers.
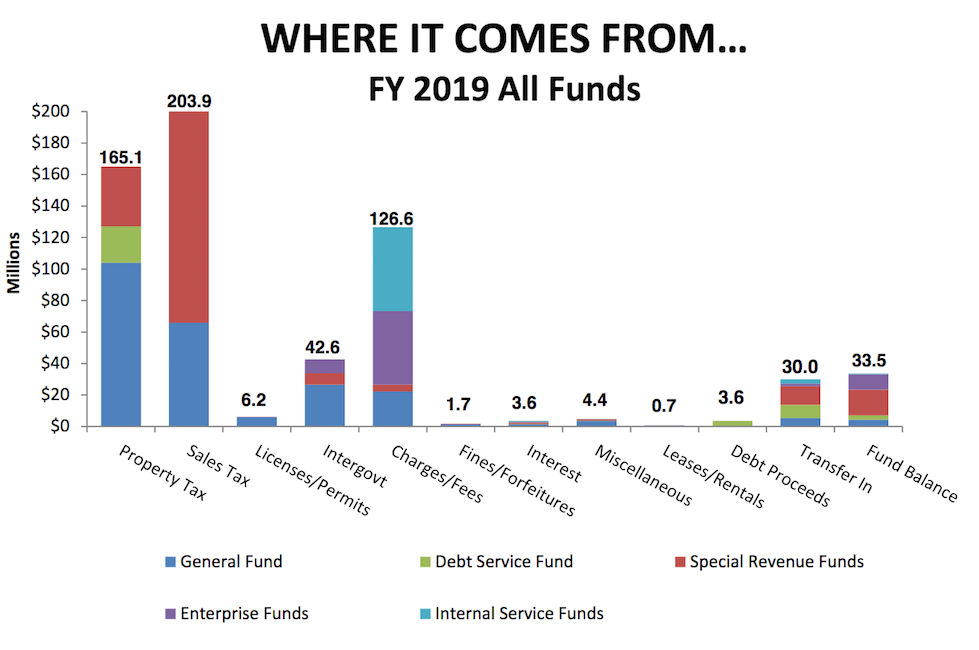
Where is the money coming from?
- Sales Tax – $203.9 Million
- Property Tax – $165.1 Million
- Charges / Fees – $126.5 Million
- Intergovt – $42.5 Million
- Fund Balance – $33.5 Million
- Transfer In – $30.0 Million
- Licenses / Payments – $5.2 Million
- Miscellaneous – $4.4 Million
- Debt Proceeds – $3.6 Million
- Interest – $3.5 Million
- Fines / Forfeitures – $1.7 Million
- Leases / Rentals – $0.7 Million
If the Sales Tax number strikes you as quite high, it is because Charleston County has the highest sales tax rate in the state of South Carolina at 9.0%

A few excerpts from the narrative
- Given the growth, there was an 80% decrease in number of roads inspected from FY 2017 (351) to FY 2018 (69)
- Charleston County population growth decreased (percentage) from FY 2017 (1.8%) to FY 2018 (1.23%)
- Permits issued: FY 2017 – 11,928 / FY 2018 – 11,853 / Projection: FY 2019 – 12,000
- Veteran Affairs Office Visits/Contacts – FY 2017 – 28,087 / FY 2018 – 42,566 (52% increase)
- Library Goals: Open 2 new libraries in 2018, and begin construction on 3 new libraries – Decline in library visits: FY 2017 – 1,670,712 / FY 2018 – 1,543,027
- Number of active voters declined: FY 2017 – 286,008 / FY 2018 – 269,445
Complete 504 Page Narrative – FY 2019 Budget