South Carolina comes in second for the most drunk driving accidents in the nation.
According to SafeWise, the Palmetto state falls second behind Wyoming.
The state had a rate of more than six deaths for every 10,000 people.
Eighty percent of the worst states have no minimum jail time for first-time DUI offenders. South Carolina is the outlier, with two days for a first offense.
Keep conclusions from the most dangerous states
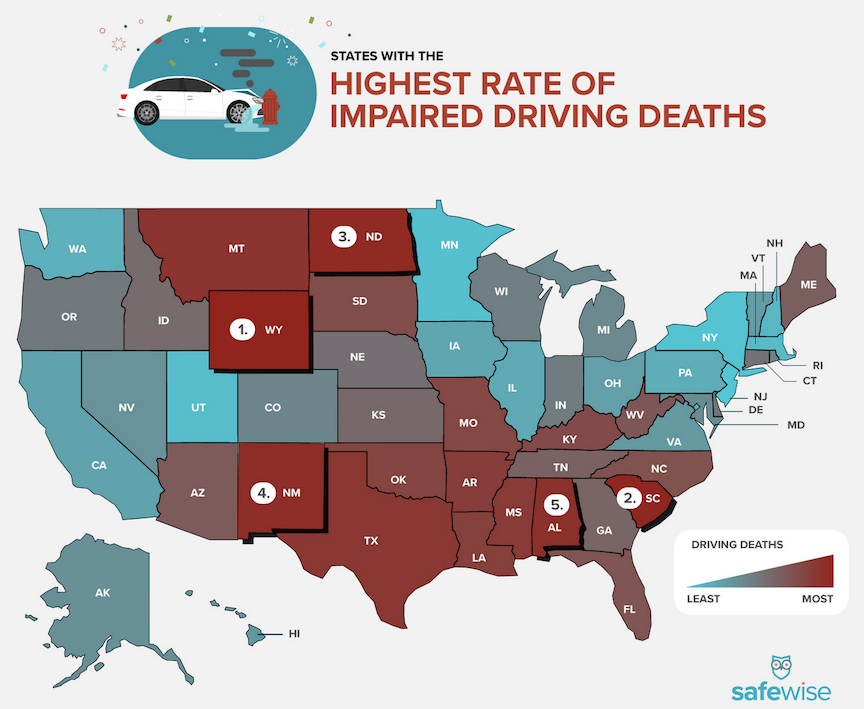
- 80% of the most dangerous states were also in the top five in 2016—Wyoming is the only newcomer, replacing Montana as the state with the most impaired driving deaths per capita.
- Montana went from the state with the most dangerous roads (9.58 drunk driving deaths per 100,000 people in 2016) to number 27, with 5.33 deaths per 100,000.
- Wyoming climbed from eighth place (5.98 deaths/100,000) to the worst state for impaired driving fatalities, topping the list with 7.59 deaths per capita in 2017.
- Every state in the five worst (except Wyoming) decreased its rate of drunk driving deaths year over year in 2017.
- 80% of the worst states have no minimum jail time for first-time DUI offenders. South Carolina is the outlier with two days for a first offense.³
- The majority of US states require mandatory alcohol abuse assessment or treatment after a DUI conviction, but neither is required in four out of the five worst states for drunk driving deaths.⁴
- Among the five states with the most drunk driving deaths, the average minimum fine for the first DUI conviction is $300, compared to $524 among the five states with the fewest drunk driving deaths.⁵’
Complete Rankings – Most Dangerous to Least (Deaths Per 100,000 People)
| Rank | State | Deaths per Capita |
| #1 | Wyoming | 7.60 |
| #2 | South Carolina | 6.23 |
| #3 | North Dakota | 6.09 |
| #4 | New Mexico | 5.75 |
| #5 | Alabama | 5.50 |
| #6 | Montana | 5.33 |
| #7 | Texas | 5.19 |
| #8 | Mississippi | 4.96 |
| #9 | Arkansas | 4.66 |
| #10 | Louisiana | 4.53 |
| #11 | Oklahoma | 4.20 |
| #12 | Missouri | 4.15 |
| #13 | Kentucky | 4.06 |
| #14 | South Dakota | 4.02 |
| #15 | North Carolina | 4.02 |
| #16 | Florida | 4.00 |
| #17 | West Virginia | 3.97 |
| #18 | Arizona | 3.96 |
| #19 | Maine | 3.74 |
| #20 | Tennessee | 3.74 |
| #21 | Georgia | 3.51 |
| #22 | Kansas | 3.50 |
| #23 | Idaho | 3.49 |
| #24 | Nebraska | 3.49 |
| #25 | Connecticut | 3.34 |
| #26 | Delaware | 3.33 |
| #27 | Oregon | 3.31 |
| #28 | Indiana | 3.30 |
| #29 | Wisconsin | 3.28 |
| #30 | Rhode Island | 3.21 |
| #31 | Colorado | 3.16 |
| #32 | Michigan | 3.12 |
| #33 | Maryland | 3.07 |
| #34 | Alaska | 2.97 |
| #35 | Nevada | 2.97 |
| #36 | Hawaii | 2.94 |
| #37 | Virginia | 2.90 |
| #38 | Vermont | 2.89 |
| #39 | Ohio | 2.86 |
| #40 | California | 2.83 |
| #41 | Iowa | 2.80 |
| #42 | Illinois | 2.73 |
| #43 | Pennsylvania | 2.45 |
| #44 | Washington | 2.40 |
| #45 | DC | 2.31 |
| #46 | New Hampshire | 2.01 |
| #47 | Massachusetts | 1.75 |
| #48 | Utah | 1.71 |
| #49 | Minnesota | 1.52 |
| #50 | New York | 1.49 |
| #51 | New Jersey | 1.39 |